Searching, Analysing and Visualizing in Splunk


In this article we will see how to Analyse and Visualize a dataset using Splunk "Search & Reporting App"


We have already uploaded a dataset (.csv file) that contains information on confirmed cases of Covid-19 across different countries.
Refer to my blog "Adding dataset to Splunk" to learn about uploading a CSV dataset file to Splunk.
The dataset is free to download from https://data.humdata.org
Once you have finished loading your dataset, Click on Search & Reporting.
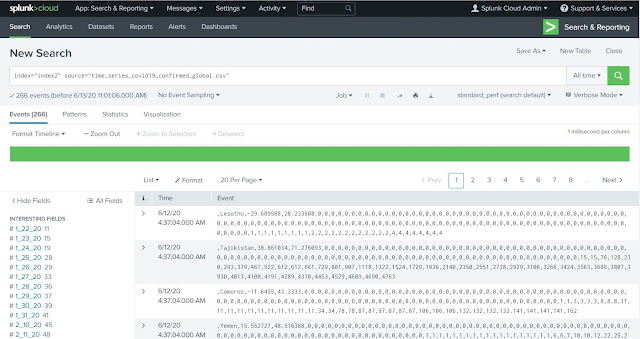
Check that your dataset is uploaded successfully. In my case, I have uploaded the dataset in an index with the name "index2" and the name of my csv file is "time_series_covid19_confirmed_global.csv".
As my index "index2" contains the information of other dataset as well, so I will put another filter to include the source name.
Based on when the dataset was uploaded, you can adjust the drop down which I have left to default "All time"
All the events (records) from the dataset are displayed in the Events tab.
On the left side of the result all the fields which are extracted by Splunk engine from the csv file are displayed.
Analyzing the Dataset
index="index2" source="time_series_covid19_confirmed_global.csv"

Understanding the Dataset Fields:
Country_Region: Name of the Country or Region
Case Count: There are several date fields in the dataset, which represents the total confirmed cases of Covid-19 for that Country till the date mentioned in the field name. For example: field name 6_10_20 holds the confirmed cases for each country until 10th June 2020.
Lat & Long Fields: Latitude and Longitude coordinates of each country.
In the next step, we will use the table command to show the data of the interested fields in a tabular format.
As the dataset I have used is until 10th June 2020, so I will be using only the last date field 6_10_20 which contains the total confirmed cases till 10th June 2020.
index="index2" source="time_series_covid19_confirmed_global.csv" | table Country_Region 6_10_20 Lat Long

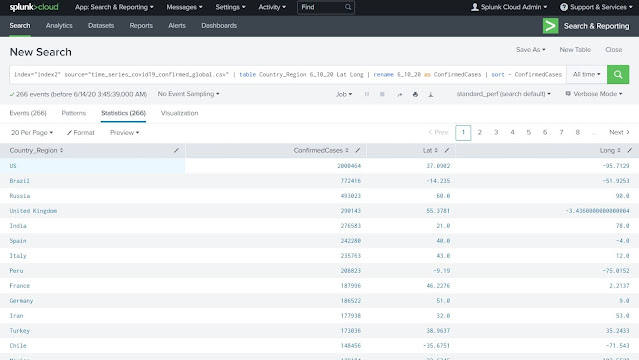
We will do the following in next step of the query:
Rename the field 6_10_20 to "ConfirmedCases"
Sort the output table in descending order with ConfirmedCases field
Use the head command to pick only top 20 countries
Again sort the output with country_Region field
index="index2" source="time_series_covid19_confirmed_global.csv" | table Country_Region 6_10_20 | rename 6_10_20 as ConfirmedCases | sort - ConfirmedCases | head 20 | sort Country_Region ConfirmedCases

Click on Save As to save the output table to a New Splunk Dashboard with the Title "Covid-19 Dashboard" and Panel Title as "Top 20 Countries by Case Count - Tabular"
Next Click on Visualization and change the chart type to Column Chart
Click on Save As to save the output table to the existing Splunk Dashboard that we just created in the previous step "Covid-19 Dashboard" and Panel Title as "Top 20 Countries by Case Count - Column Chart"
Let's view our Dashboard. Click on Dashboards tab and further click on "Covid-19 Dashboard". The dashboard should look like this:

Further I have modified my query using geostats command to plot the confirmed case count on the world map using coordinates provided in lat and long columns (latitude and longitude)
index="index2" source="time_series_covid19_confirmed_global.csv" | rename 6_10_20 as ConfirmedCases | table Country_Region ConfirmedCases Lat Long | sort - ConfirmedCases | geostats avg(ConfirmedCases) by Country_Region latfield=Lat longfield=Long
Save the result to the same dashboard "Covid-19". Dashboard should look like below:

Comments
Post a Comment